Investment Risk on the CFP Board Exam: Part III

Good to Know
Question: Why should financial planners and advisors care about skewness?
Answer: A negative skew can obscure excess downside risk in a portfolio.
We discussed the mean (geometric average) return and standard deviation in our first two blogs. Now we’ll use those concepts to illustrate skewness in this, the third installment in our four-part investment risk series.
CFP Board expects certificants to understand the impact of skewness on investment risk. The word “skewness” can be a bit intimidating, even for advisors and planners, because it is thought to be overly complex. Here’s the good news—the concepts themselves are quite straightforward; it’s all about understanding the potentially hidden risk in certain skewed distributions. Hence, we’ll focus on the concepts rather than the minutiae of calculating the exact skewness factor. Let’s begin with a familiar concept from this blog series, normal distributions, and then address the implications of skewness.
Normal Distributions
A normal distribution is perfectly symmetrical. The curve to the left of the mean return and the curve to the right of the mean return are perfectly symmetrical. A normal distribution plotted on paper could be cut in half vertically at the mean return and folded over onto itself. The result would be a perfect alignment of the two halves with no underlap or overlap. Consider the graph and example below.
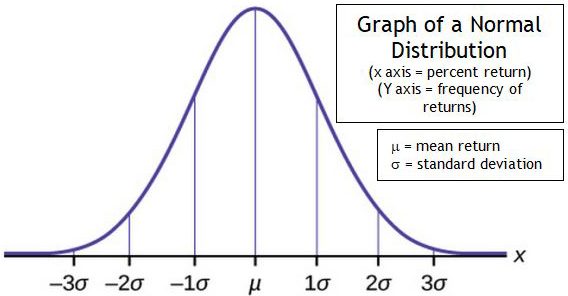
We learned in an earlier blog article that there is a greater than 99% probability1 that portfolio returns will fall between +/- 3σ from the mean return in a normal distribution. Returns more than +/- 3σ from the mean are considered extreme returns or “outliers.” The financial press may refer to these extreme returns as “black swans.” 2
This can be demonstrated with a quick example.
| Example
Assume the mean return in a normal distribution is 8%, and the standard deviation is 4%. What can we infer from the chart under those assumptions?
|
Here’s the takeaway — normal distributions have a skew of 0. The distribution of returns is skewed neither toward outlier losses nor outlier gains.
Skewness
The distribution of returns from a portfolio is not generally symmetrical in the real world. Distributions that are not symmetrical are referred to as asymmetrical. Skewness simply measures the degree of asymmetry in a distribution. As we’ll see in just a moment, skewness can work for us or against us. Asymmetric distributions are either negatively or positively skewed when compared to a normal distribution. We’re about to dive deeper into skewed returns, but first, we need to discuss “mode” and “median” returns.
Mode and Median Returns
Your understanding of excess downside risk in a skewed distribution now hinges on a working knowledge of mode and median. For example, consider the chart below.
| Year | Return |
| 1 | -20% |
| 2 | -15% |
| 3 | -1% |
| 4 | 1% |
| 5 | 4% |
| 6 | 4% |
| 7 | 7% |
The mode is simply the return percentage that occurs most frequently in the distribution. The mode is 4%.The median is the mid-point of the returns.
The median return is 1% because one-half of the returns are less than 1% and one-half of returns are greater than 1%.
In a normal distribution, the mode, median, and mean are the same. The distribution is skewed neither left nor right. The skew is said to be zero. However, this is not true for skewed distributions. Asymmetric distributions are either negatively or positively skewed.
Negative Skewness
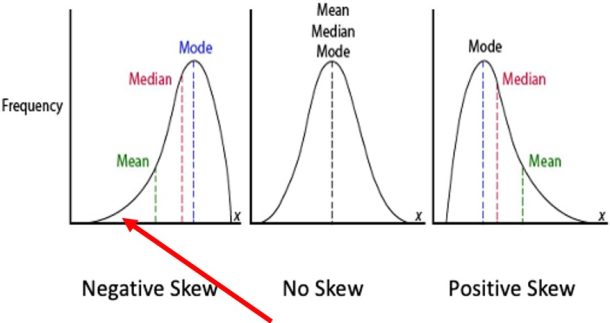
A negative skew has a skewness of less than zero. Examine the graph to the right. A negative skew indicates a distribution in which the mean return is less than the median and mode return. What does that mean for our purposes?
It means that more extreme returns fall on the left side of the distribution (reflected by longer ‘tails’ on the left side) than on the right side of the distribution. Stated another way, more extreme returns occur below the mean return than above the mean return. There is a tendency for extremely negative returns to occur more frequently in a distribution with negative skew than in a normal distribution with a skew of zero.
For example, if the mean return were zero, we would expect more extreme losses than extreme gains in a negatively skewed distribution. Regrettably, most asset classes, including equities and bonds, tend to exhibit negative skew. Whereas the skewness of a normal distribution is zero, skewness is less than zero in a negatively skewed distribution. A skewness of -1 (or any value less than zero) is a negative skew.
Positive Skewness
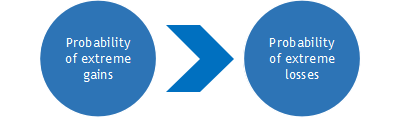
 The opposite is true for positive skew. The mean return is higher than the median and the mode return in a positively skewed distribution. What does this fact signify for clients? This indicates that more extreme returns are expected to occur on the right side of the mean than on the left side when compared to a normal distribution.
A positively skewed distribution is characterized by longer “tails” on the right side of the mean. For example, if the mean return were zero, we would expect more extreme gains than extreme losses if the skew was +1 (or any value greater than zero).
Summary
Let’s pause for a moment to remember that most clients fear investment losses more than they desire investment gains.3 It’s possible for a symmetrical (normal) distribution, a negatively skewed distribution, and a positively skewed distribution to have the same mean return. The concept of skew is most easily understood when the mean return is zero, but the concept remains valid no matter the value of the mean return. Now let’s briefly summarize what we’ve learned about skew in this article.
Positive Skew
The skewness factor is greater than zero. Extreme gains are expected to occur more frequently than extreme losses. Clients generally prefer a positive skew, but most distributions are negatively skewed.
Positive Skew
No Skew
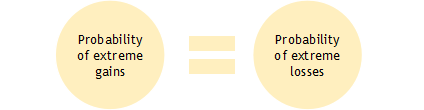
The skewness factor is zero. Extreme gains are expected to occur with the same frequency as extreme losses. All things being equal, clients prefer no skew to a negative skew.
No Skew
(Normal Distribution)
Negative Skew
The skewness factor is less than zero. Extreme losses are expected to occur more frequently than extreme gains. Regrettably, most return distributions are negatively skewed. All other things being equal, clients tend to prefer the least negative skew possible.
Negative Skew
The Bottom Line
Clients tend to seek the smallest excess downside risk (negative skew), assuming the same mean return and other factors. Happiness is a positive skew or, if that’s not possible, the least negative skew.
Coming Attraction
Our fourth and final article deals with a concept referred to as Kurtosis. Kurtosis is important because certain kurtotic distributions can also obscure downside investment risk.
Disclaimer
The information presented herein is provided purely for educational purposes and to raise awareness of these issues; it is not meant to provide and should not be used to provide gift, estate, generation-skipping, or financial planning advice of any kind. An experienced estate planning attorney should advise clients in these transfer tax issues. There are variations, alternatives, and exceptions to this material that could not be covered within the scope of this blog.
1 Refer to Blog II in this series, Using Standard Deviation to Manage Investment Risk, for a refresher on standard deviation and normal distributions.
2 The term “black swan” was coined by 16th century Europeans, unaware of the black swan population in Australia, to describe what they believed to be the impossibility of a black swan.
3 Kahneman, D., & Tversky, A. (1977). Prospect Theory. An Analysis of Decision Making Under Risk.