Investment Risk on the CFP Board Exam: Part II

Good to Know
This blog is the second in a four-part series that includes:
- Part I: When to trust the “mean” return,
- Part II: Using standard deviation to manage investment risk,
- Part III: Skewness—Do we want negative or positive skew in our portfolio?, and
- Part IV: Kurtosis of a return distribution—Is more kurtosis a good thing?
This blog will discuss the following topics:
- Standard deviation,
- Systematic and Nonsystematic risk, and
- The bell curve.
You Can Trust Standard Deviation
One of the goals of asset allocation is to manage the standard deviation of an investment portfolio. Standard deviation is defined as the dispersions in outcomes, or variability of outcomes, around the geometric mean return. From another perspective, standard deviation is the degree to which portfolio returns vary over time about the geometric mean. We discussed the absolute reliability of the geometric mean return in Part I of this four-part blog series.
Similarly, standard deviation is an absolutely trustworthy measure of all investment risk in a portfolio. More specifically, standard deviation includes both systematic and nonsystematic risk.
Systematic and Nonsystematic Investment Risk
Systematic risk, also known as non-diversifiable risk, is the risk attributed to broad macroeconomic factors affecting all securities. Systematic risk cannot be avoided and includes:
- Purchasing power risk—the risk that inflation will decrease the real return of a portfolio,
- Reinvestment rate risk—the risk that maturing fixed income securities cannot be reinvested at the same rate of return (this occurs in a falling interest rate environment),
- Interest rate risk—the risk that the bonds in a portfolio will fall in value if interest rates rise,
- Market risk—the risks that the market will decline resulting from acts of God and man. Examples include a natural disaster, terrorism, and civil unrest, and
- Exchange rate risk—the risk that capital gains, dividends and interest paid on foreign securities in our portfolio will convert into fewer U.S. dollars as the result of exchange rate changes.
Nonsystematic risk, also known as firm-specific risk, is that risk attributed to factors unique to a specific security, business, or industry. Stated another way, nonsystematic risk includes all investment risks except systematic risk. The most important thing to remember about nonsystematic risk is that this risk CAN be diversified away! Examples of nonsystematic risk include poor management, over-leveraging, default, lack of liquidity, and obsolescence.
Our Friend The Bell Curve
Standard deviation can be presented graphically by a bell curve, which plots the historical distribution of returns in a portfolio. If the curve is perfectly symmetrical as in the bell curve below, standard deviation can help us manage investment risk in a portfolio and forecast a range of probable future returns.
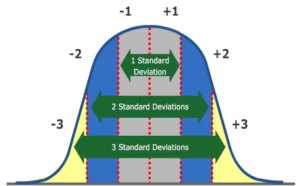
For example, assume the geometric mean return of a portfolio is 10% and the standard deviation is 4%. We can now forecast the expected ranges of future returns.
- 68% of the time, the annual return will fall within +/- 1 standard deviation from the geometric mean return. That means that 68% of the time the annual return will be between 6% and 14% (this corresponds to the gray area under the bell curve). The 6% is the geometric mean return of 10% minus one standard deviation of 4%. The 14% is the geometric mean return of 10% plus one standard deviation of 4%.
- 95% of the time, the annual return will fall within +/- 2 standard deviations from the geometric mean return, i.e., 2% and 18% respectively (this corresponds to the gray and blue areas under the bell curve), and
- Over 99% of the time, the annual return will within +/- 3 standard deviations from the geometric mean return, i.e., between -2% and 22% (this corresponds to the gray, blue, and yellow areas under the bell curve).
If our client wanted a portfolio that is highly unlikely to incur a loss greater than 2%, the example portfolio may be appropriate.
The Bottom Line
Standard deviation can be trusted to give us accurate forecasts of the range of expected returns in the future and is one of the tools used to help us create portfolios within a client’s risk tolerance.
Coming Attractions
Our next blog in this series will build upon the geometric mean and standard deviation to discuss the implications of when a return distribution is not perfectly symmetrical.
Disclaimer
The information presented herein is provided purely for educational purposes and to raise awareness of these issues; it is not meant to provide and should not be used to provide gift, estate, generation-skipping, or financial planning advice of any kind. An experienced estate planning attorney should advise clients in these transfer tax issues. There are variations, alternatives, and exceptions to this material that could not be covered within the scope of this blog.