Investment Risk on the CFP Board Exam: Part IV

Good to Know
This is the final article of our four-article series on investment risk for the CFP Board exam. Here’s a reminder of the risk concepts we’ve covered so far in the series:
- Part I: When to trust the “mean” return,
- Part II: Using standard deviation to manage investment risk, and
- Part III: Skewness—Do we want negative or positive skew in our portfolio?
In Part IV of our series, we’ll define kurtosis, reveal how it is measured, and illustrate kurtosis (“tail risk”) in return distributions. Following that, we’ll summarize how kurtosis can obscure investment risk.
What is Kurtosis?
Kurtosis is a measure of the expected frequency of extreme returns (either losses or gains) at the edges (“tails”) of a return distribution. Kurtosis is a different investment risk measure than the subject of our last article, skewness. Before proceeding, let’s distinguish between the two risk measures.
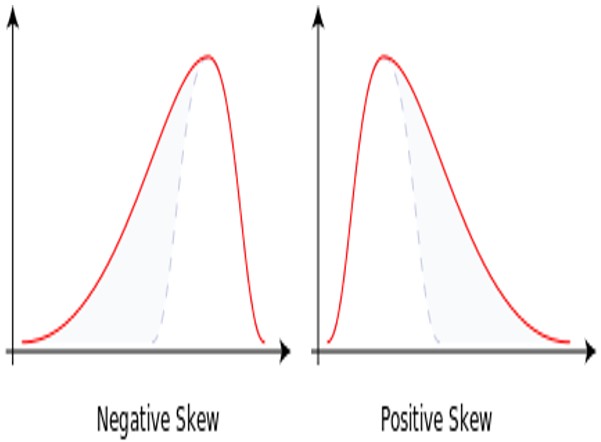 Skewness describes how the peak of a distribution leans to the left or the right. For example, the peak of a positively skewed distribution leans to the left. Extreme gains are expected to occur more often than extreme losses in a positively skewed distribution. The opposite is true for a negatively skewed distribution.
Kurtosis measures the expected frequency of extreme losses and gains based on the far ends of the distribution (the “tails”). As opposed to focusing on the way the peak leans as in skewness, kurtosis focuses on the potential for extreme losses or gains in the “tails” of a distribution. Before illustrating kurtosis graphically, let’s first understand how kurtosis is measured.
How Is Excess Kurtosis Measured?
Kurtosis is present even in perfectly symmetrical normal distributions. As you would expect, the degree of kurtosis in a normal distribution is considered a baseline (normal) amount of kurtosis. Consequently, we’re focused on kurtosis that exceeds that found in normal distributions, that is, excess kurtosis. Excess kurtosis is measured relative to the excess kurtosis (zero) found in a normal distribution.
Excess kurtosis can be neutral, positive, or negative. Counterintuitively, we want a negative result for excess kurtosis. Let’s analogize kurtosis with our worldwide pandemic. When we’re tested for COVID we want a negative result, indicating we do not have the virus. From an investment risk perspective and assuming all other factors are equal, investors prefer a negative excess kurtosis, indicating the portfolio has no excess kurtosis. The summary chart below illustrates how excess kurtosis is quantified.
| Numeric Value | Type | DISTRIBUTION TYPE | DISTRIBUTION SHAPE |
| 0 | Neutral | Normal | Normal |
| > 0 | Positive | Highly kurtotic | “Fat Tails” |
| < 0 | Negative | Non-kurtotic | “Skinny Tails” |
Next, we’ll give context to the terms “fat tails” and “skinny tails” by illustrating “tail risk” in a distribution of portfolio returns.
“Tail Risk”
Tail risk is the probability of extreme losses and gains in the “tails” of a return distribution.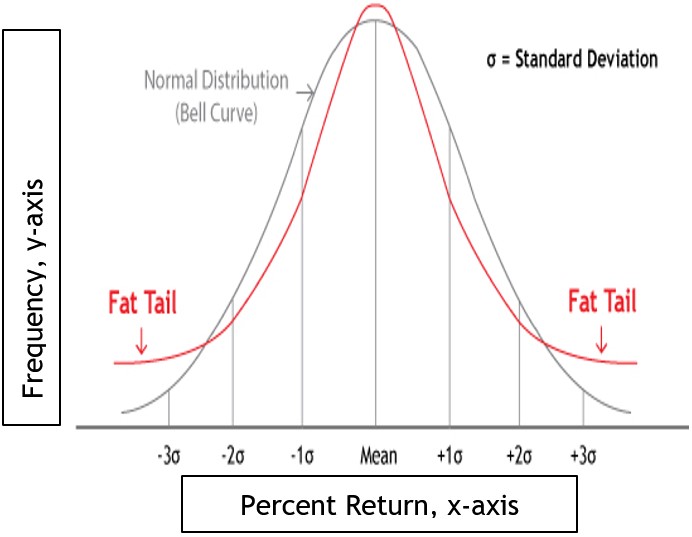
Consider the distribution curves to the right. The curves represent a normal distribution with no excess kurtosis and a distribution with excess kurtosis (“fat tails”).
First, let’s focus on the normal distribution. You’ll notice that the risk of extreme loss is the same as the potential for extreme gain. Stated another way, the probability of a loss exceeding three standard deviations to the left of the mean return is the same probability as a gain exceeding three standard deviations to the right of the mean.
Now consider the “fat-tailed” distribution. We’ll discuss fat tails in just a moment but for now, notice that the probability of extreme loss vs. extreme gain is equal in the graph with the fat tails. That observation begs the question, “what makes excess kurtosis such an important risk if the probability of outlier losses is the same as the probability of outlier gains?”
The answer lies in two factors:
- The frequency (y-axis) of extreme losses or gains is higher in a distribution with excess kurtosis than in a normal distribution, and
- The higher the potential for extreme losses, the more investors fear losses. Remember that investors tend to fear losses more than they desire equivalent gains.
In contrast, a “skinny-tailed” distribution would have tails lower than those in a normal distribution, indicating that the risk of extreme losses and gains is even lower than in a normal distribution.
Summary
What is expected of examinees taking the CFP Board exam? You’re expected to know:
- The difference between negative kurtosis (good) and positive kurtosis (bad),
- How to recognize excess, i.e., positive kurtosis on a graph, and
- How to use kurtosis as one of the criteria to evaluate investment risk in a portfolio.
Disclaimer
The information presented herein is provided purely for educational purposes and to raise awareness of these issues; it is not meant to provide and should not be used to provide gift, estate, generation-skipping, or financial planning advice of any kind. An experienced estate planning attorney should advise clients in these transfer tax issues. There are variations, alternatives, and exceptions to this material that could not be covered within the scope of this blog.